Federal Economic Analysis 2025 Consumer Spending Trends Analysis
California residents allocate a higher proportion of their consumer spending to services such as rent, dining out, and leisure activities compared to the national average.
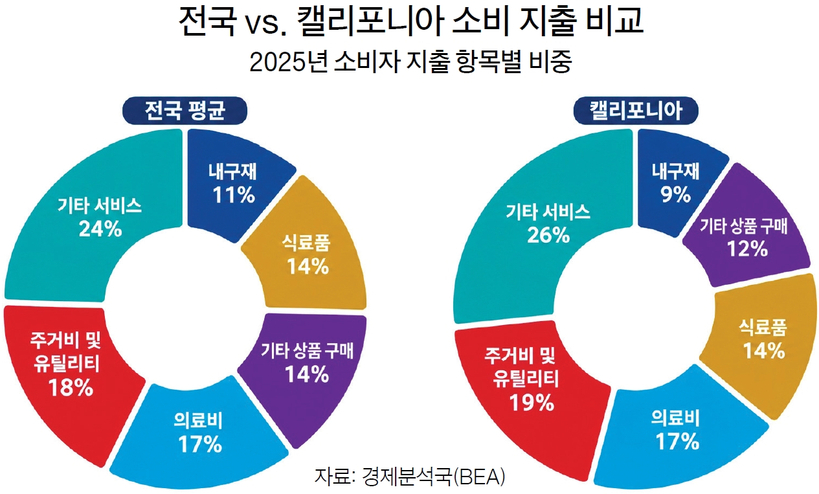
According to 2025 consumer spending data recently released by the Bureau of Economic Analysis (BEA), the proportion of housing and utility costs combined in California’s total consumer spending was 19%, which is 1 percentage point higher than the national average of 18%.
The proportion accounted for by rent was 5.2%, which is 1.5 percentage points higher than the national average of 3.7%.
This is the item with the largest gap between California and the national average among the 72 detailed consumer items surveyed. High rents and a higher proportion of renters than the national average are cited as the main causes.
The fact that the rent gap is larger than overall housing costs is interpreted as reflecting the influence of homeowners who have owned their homes for a long time and have no mortgage burden or are maintaining loans with low interest rates.
Looking at changes over the past 10 years, California’s rent expenditure share dropped from 5.6% in 2015 to 5.2% last year. However, as the number of residents with high income and spending power choosing rentals instead of buying homes has recently increased, it is possible that the proportion of rent in total consumption has decreased.
In addition, California’s consumption was relatively concentrated in service sectors such as housing, medical care, dining out, and leisure rather than purchasing goods.
The amount spent on dining out among California residents’ total consumer spending was 6.7%, surpassing the national average of 6.2%. Compared to 5.9% in 2015, it rose by 0.8 percentage points over 10 years.
Expenditures related to leisure and cultural activities were also relatively high. Costs used for membership clubs, sports centers, parks, theaters, museums, etc., accounted for 2.5% of total spending, which is 1 percentage point higher than the national average of 1.5%. Lodging expenses such as hotels also surpassed the national average at 1.3% compared to 1.0%.
On the other hand, California residents had a lower expenditure proportion on hospital bills and car purchases than the national average. Durable goods spending, such as home appliances and furniture, was 9%, lower than the national average of 11%, and other goods spending also fell below the national average of 14% at 12%.
Hospital bills accounted for 6.3% of total consumer spending, 1.4 percentage points lower than the national average of 7.7%, showing a picture opposite to rent. Spending on pharmaceuticals and other medical supplies also fell below the national average of 3.5% at 2.9%.
The ratio of car purchases was also lower than the national average. New car purchase costs accounted for 1.5% of total consumption, lower than the national average of 2.0%, and used car purchase costs also fell short of the national average of 1.1% at 0.6%.
Meanwhile, this statistic compares the proportion of each item in total consumer spending rather than the spending burden relative to income by household, so actual prices or perceived living cost burdens may vary.